


Australian Multi-Screen Report claims Australians are watching more TV
The latest Australian Multi-Screen Report from OzTAM, Regional TAM and Nielsen claims Australians are watching more TV on in-home sets than they did a year ago, and using internet-connected devices to complement their TV viewing.
The announcement:
The latest Australian Multi-Screen Report, covering the fourth quarter of calendar 2013, shows robust viewing of broadcast television on in-home TVs.
Australians are spending more time watching conventional television than they did a year ago and are also using Internet-connected devices to complement their viewing of TV and other video.
The increasingly connected, multi-screen Australian household
An estimated 40 per cent of homes now have tablets (up from 27 per cent in Q4 2012, and 37 per cent in Q3 2013).
68 per cent of Australians aged 16+ own a smartphone (59 per cent a year ago).
Internet capable TVs are now in 23 per cent of homes (20 per cent in Q4 2012).
PVRs are now in 53 per cent of homes (52 per cent in Q4 2012), with 14 per percent having two or more (12 per cent a year ago). PVR penetration has been stable in recent quarters.
As the transition to fully-digital television was completed, 99 per cent of homes had digital terrestrial television (DTT) by the fourth quarter of 2013, and 91 per cent had all working household TV sets DTT-capable.
Viewing of TV and other video across multiple screens
Amid the steady adoption of new technologies, Australians of all ages use their traditional TV sets for the overwhelming majority of time they spend consuming TV and other video.
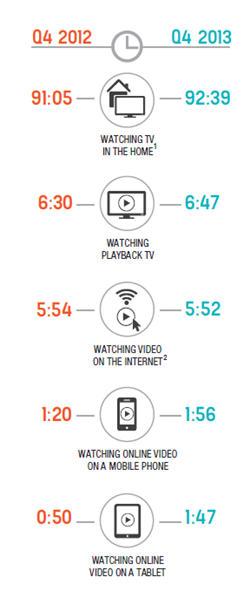
In Q4 2013 people watched an average of 92 hours and 39 minutes (92:39) of broadcast television each month on their in-home TVs, a rise of 1 hour and 34 minutes (1:34) since Q4 2012.
Viewing of TV content that people record and play back within seven days of original broadcast (‘Playback’) rose just over 15 minutes year-on-year, now accounting for 6:47 each month.
In the fourth quarter of 2013 Australians spent 5:52 per month viewing video online (i.e., streamed video such as internet-delivered catch up TV as well as other content) on a PC or laptop.
Video viewing on smaller, connected devices continues to rise in tandem with their progressive take-up.
Australians claim to spend 1:56 per month watching any online video on a smartphone (up from 1:20 a year ago), and 1:47 on tablets, compared to the self-reported 50 minutes per month for tablet viewing in Q4 2012.
Evolving viewing patterns by age group
Australians’ viewing patterns are also broadening as they move between devices such as PCs/laptops, smartphones and tablets in addition to their television sets.
With broadcast TV viewing up more than 90 minutes per month across the population year-on-year, this indicates people are using these additional screens to complement, rather than replace, the time they spend watching traditional TV.
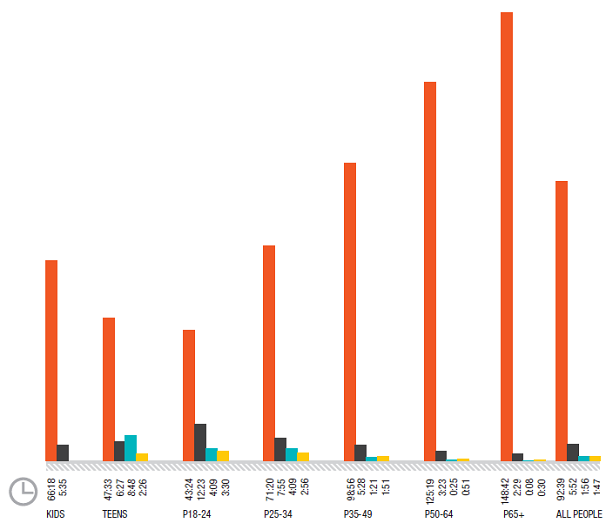
While video viewing on portable devices skews to younger audiences, most age groups are watching more television year-on-year and all demographics spend the majority of their screen time watching broadcast television on conventional sets.
Teens are the heaviest viewers of video on mobile phones; they report spending 8:48 per month doing so in the quarter compared to 1:56 across the population. Teens also spend 47:33 per month watching broadcast television (both Live and Playback within seven days of original broadcast) on conventional TV sets.
18-24s watch the most video on tablets, claiming an average of 3:30 per month, considerably higher than the reported 1:47 for Australians on the whole.
18-24s also watch the most video on a PC/laptop: 12:23 per month compared to 5:52 across the wider population. 18-24s spent on average 43:24 per month watching TV in the home during Q4 2013.
People aged 50-64 have the highest Playback viewing, at 9:13 in the quarter (6:47 for all people). However, since Q4 2012 Playback viewing has increased among teens, 18-24s and 25-34s, rising by 8, 23 and 4 minutes, respectively.
Consistent with the long-evident viewing lifecycle, people over 65 watch the most television, averaging 148:42 per month in the quarter.
OzTAM CEO Doug Peiffer said: “Even with extensive new screen and platform options, Australians are viewing as much broadcast television as they have in years. The Multi-Screen Report draws on Australia’s best audience measurement sources to provide a unique and holistic view of how Australians are actually watching TV and other video content across various screens.”
Regional TAM Chair Deborah Wright said: “ The Multi-Screen Report continues to reflect strong growth in adoption of new technologies, particularly with tablets and internet enabled TVs, in households across regional Australia which is in line with growth in metropolitan markets.”
Summary of key findings: Q4 (October – December) 2013:
· Australians watch on average 92 hours and 39 minutes (92:39) of broadcast TV on traditional television sets per month[1].
· 92.7% of all broadcast TV viewing is Live, with Playback of broadcast content that viewers record and watch within seven days accounting for 7.3% (6:47 per month).
· 99% of homes have converted to digital terrestrial television (DTT), with 91% having converted every working set in the home.
· 53% of homes have PVRs; 14% have two or more (52%; 12% in Q4 2012).
· Household internet penetration is stable at 80%.
· Australians spend on average 37:39 per month online[2].
· Internet capable TVs are in 23% of homes (20% in Q4 2012).
· 40% of homes have tablets (27% in Q4 2012).
Across the online population aged 16+, people claim to spend an average 1:47 per month[3] using tablets to watch any online video, which can include both broadcast TV and non-broadcast content.
· 68% of Australians aged 16+ own a smartphone (59% in Q4 2012) and self-report an average 1:56 per month[4] viewing any video on these devices (1:20 a year earlier).
· 12.08 million Australians watch some video (both television broadcast and non-broadcast content) on the Internet each month: an average of 5:52 per month (5:54 in Q4 2012). Such viewing is highest among people aged 18-24 (12:23)[5].
· 90.6% of all video viewing[6] – including broadcast and non-broadcast video – is on the traditional TV set, with other devices accounting for 9.4%[7]:
o 92:39 per month on the TV set (90.6%)
o 5:52 per month online via PCs/laptops (5.7%)
o 1:56 per month on smartphones (1.9%)
o 1:47 per month on tablets (1.7%)
[1] All people figures. 2am-2am.
2 Nielsen Online Ratings. Ppl 2+.
3 Nielsen Australian Connected Consumers Report 2014.
4 Nielsen Australian Connected Consumers Report 2014.
5 Nielsen Online Ratings – Hybrid Streaming (formerly VideoCensus). Ppl 2+.
6 Time spent viewing via the conventional TV includes broadcast content only; video viewing on PC, tablets and smartphones (‘other devices’) can include both broadcast and non-broadcast video.
7 TV viewing: All People, Q4 2013, 2am-2am. Other devices: Ppl 16+ smartphones/tablets, Q4 2013; Internet: Ppl 2+, Q4 2013, Nielsen Online Ratings.
Sources: Nielsen, OzTAM, Regional TAM