News

SMI data shows Australia leads the US and UK on agency spend on exchanges

ExchangesNew data shows that Australia is significantly outspending its American and British counterparts in the percentage of dollars being put through programmatic trading desks and demand side platforms.

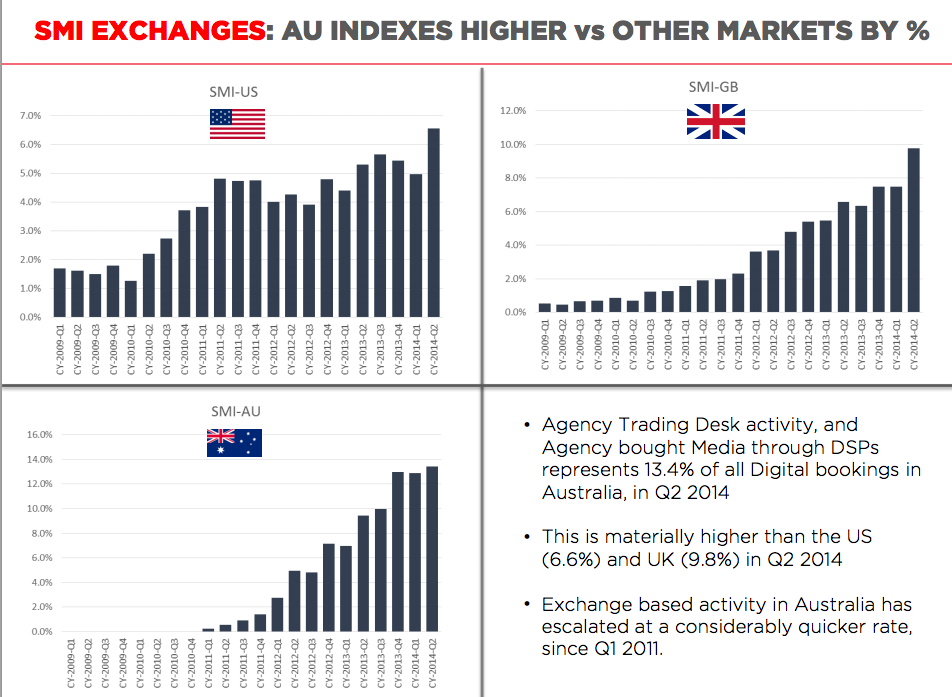
Standard Media Index (SMI), this morning, told the Spends and Trends forum that 14 per cent of all digital dollars spent by Australian media agencies were going through exchanges, a rate significantly higher than other markets the ad expenditure tracking company operates in.

Tristan Masters analytics director for SMI told the joint SMI/Mumbrella event excahanges were a “hot button issue” at the moment, adding: “In the US six and half per cent of all digital dollars are getting piped through these exchanges while in GB (Great Britain) it is slight more with 10 per cent.

“But what we are seeing is, that (exchanges) didn’t even factor until the back half of 2010, now in 2014 are just shy of 14 per cent of all digital dollars.”

Full graph Source: SMI

Source: SMI Click to enlarge

Masters also examined the difference between the US and Australian markets in spends across various media and noted that newspapers, radio and outdoor had the largest variances.

“In newspapers in the US it sits at around 5 per cent of total spend whereas in Australia it is at 11 per cent,” said Masters.

“We have a much less fragmented newspaper market, there are very few national newspapers in the US and it is much harder to buy newspapers in the US.

“In radio it sits in the US at four cents in every dollar, in Australia we are more like seven. While in the out of home sector the US runs at about three cents in the dollar while we (in Australia) run at eight cents in the dollar.”

Media

Source: SMI Click to enlarge

SMI also told the audience the retail and FMCG sectors were the two where growth in ad spend was weakest.

Masters noted that over the last six quarters in retail only quarter four of 2013 had shown growth.

“We are seeing some significant weakness in the retail category, coupled with that we are seeing a lot of softness in the FMCG space,” he said.

“What we are seeing in 2013-14 is that the peaks are still there, but the lead up is not there. It is flat as a tack in the run up to Christmas.

“Looking at quarter on quarter growth, there is still growth in the category, but it has been the worst period by reference to agency growth in a retail category since the GFC.”

The SMI data expert challenged traditional consensus around the idea of money going out of retail and into FMCG telling the audience: “In the data up to August we are seeing softness in both of these large consumer categories.”

From next month the SMI is also set to provide breakdowns of the retail category, which accounts for around a quarter of all spending, into five distinct categories: quick service restaurants; home furnishing; general retailers (retailers selling products made by others); speciality retailers (stores selling goods they make); food and alcohol retailers.

“These splits will allow us to get a lot more granular with the details,” Masters told Mumbrella last week.

“Breaking out speciality retail from general retail is important as the two behave quite diffrerently, whilst it will be good to get a proper look at the behaviour in the quick service restaurant category.”

Nic Christensen 

ADVERTISEMENT

Get the latest media and marketing industry news (and views) direct to your inbox.

Sign up to the free Mumbrella newsletter now.


SUBSCRIBE

Sign up to our free daily update to get the latest in media and marketing.