Study reveals effectiveness of video advertising across different media platforms
TV advertising industry body ThinkTV has commissioned research in a bid to help advertisers and agencies “get the best out of video advertising” – finding that while ads viewed on Facebook, YouTube and TV all generated a positive sales impact for brands, TV was responsible for the greatest sales impact and attention.
![]()
The announcement:
THE BENCHMARK SERIES TRANCHE 1: WORLD-FIRST STUDY REVEALS HOW WELL VIDEO ADVERTISING WORKS ON DIFFERENT MEDIA PLATFORMS
Groundbreaking research from respected marketing science academic Professor Karen Nelson-Field has uncovered new insights into how and why video advertising works for brands across different media platforms.
The first tranche of Professor Nelson-Field’s Benchmark Series, commissioned by ThinkTV, makes a number of significant findings that are designed to help advertisers and their agencies get the best out of video advertising.
Professor Nelson-Field used bespoke A.I. machine-learning technology and eye-tracking software to minimise human bias in her team’s data gathering, which is explained below* and here, in these short videos.
Benchmark Series Methodology in 2 minutes
Benchmark Series Methodology in 4 minutesThe study found that advertisements viewed by consumers on Facebook, YouTube and TV all generated a positive sales impact for brands. Of those platforms, TV advertising generated the greatest sales impact and attention, scoring significantly higher than Facebook and YouTube on both measures, with Facebook ahead of YouTube.
Source: ThinkTV
KEY FINDINGS:
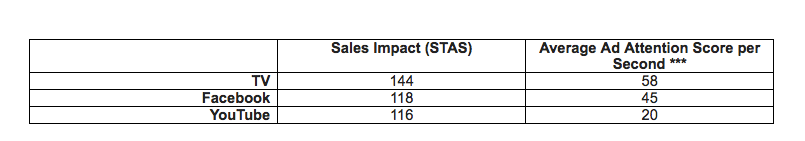
Sales
- Using the well-established metric of short-term advertising strength or STAS** to measure the impact an advertisement has on a brand’s sales, the research found that TV was 24.1% stronger than YouTube and 22% stronger than Facebook.
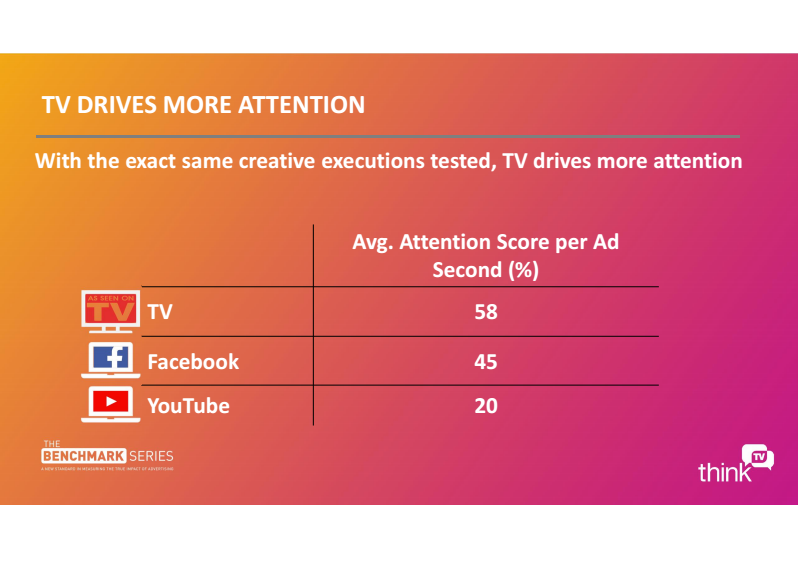
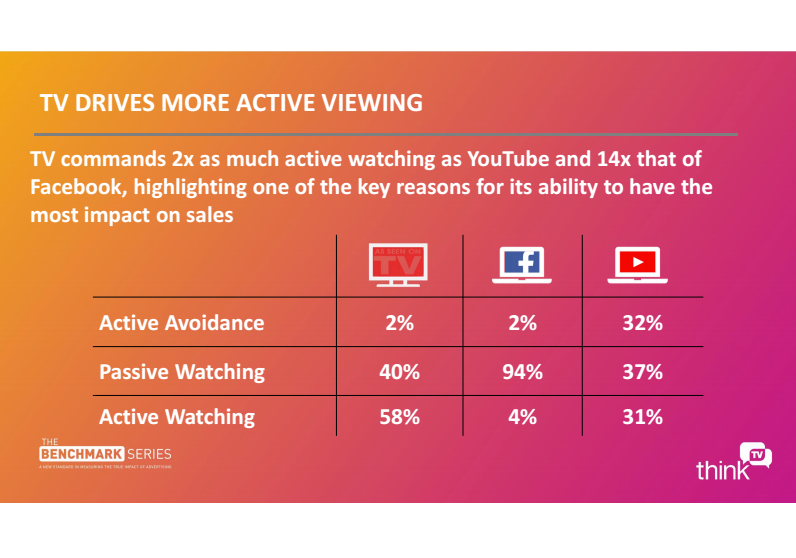
Attention
- The same pattern carried for the attention paid to an ad, which Professor Nelson-Field scored based on a number of factors including active ad viewing, active ad avoidance and passive ad avoidance, measured for each second that a commercial ran. On an aggregate of these measures, TV scored 58 points out of 100. This was 13 points higher than Facebook, which scored 45, and 38 points higher than YouTube, which scored 20.
Source: ThinkTV
Screen Coverage
The study found that screen coverage (the percentage of a screen occupied by an ad) was highly correlated to attention and sales. On this measure, TV, at 100% screen coverage, provided 10 times more “Coverage” on average than Facebook and three times more coverage than Youtube, which Professor Nelson-Field identified as one of the key reasons for TV’s ability to have the most impact on sales.Brand Prominence
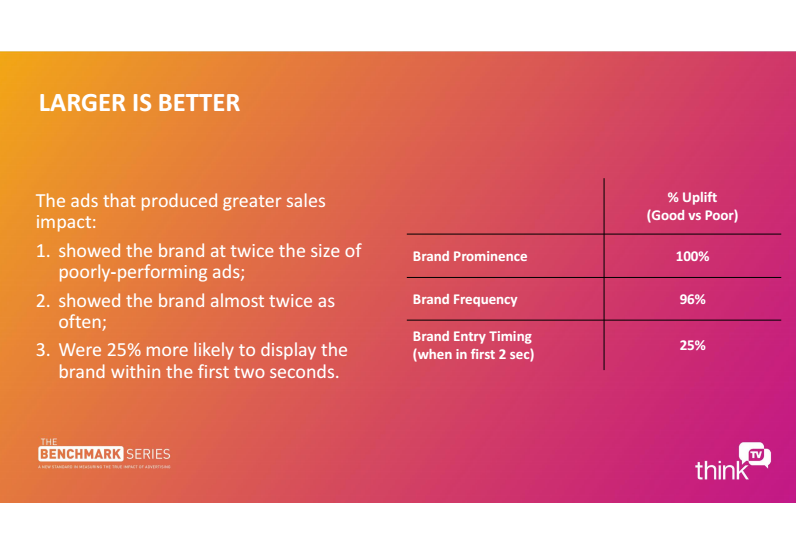
- The research also showed that the size, frequency and speed of introduction of a brand or product within a commercial correlates to attention and sales impact. The ads that produced greater sales impact:
- showed the brand at twice the size of poorly-performing ads;
- showed the brand almost twice as often;
- and were 25% more likely to display the brand within the first two seconds (see slide 31).
Click to enlarge
*** Attention scores were based on a number of factors including active ad viewing, active ad avoidance and passive ad avoidance, measured for each second that a commercial ran.
Source: ThinkTV
Professor Karen Nelson-Field said: “The Benchmark Series gets under the hood of all the major video advertising platforms and – using in-home, natural viewing conditions – provides a clear understanding of why certain platforms drive higher levels of attention and greater levels of advertising impact than others. It will help advertisers to make informed inventory choices when selecting media.”
Kim Portrate, Chief Executive of ThinkTV, said: “The first thing to note about this study is that it proves video advertising works on all these major platforms – but it also shows that not all media is equal when it comes to video advertising.
“It is well-known that TV content is professionally produced, of broadcast quality and is highly brand-safe. That is in contrast to the glut of sub-premium, user-generated content that can feature heavily on social media platforms. Karen’s results help to show why this matters for brands. It’s perhaps little wonder that many social media platforms are trying to dip their toes into TV-style content themselves – put simply, it works best for brands.”
Professor Nelson-Field will unveil these results from The Benchmark Series in Adelaide at ThinkTank on the evening of August 29 and tranche two of the findings at ReThinkTV on September 14.
* What was the Methodology?
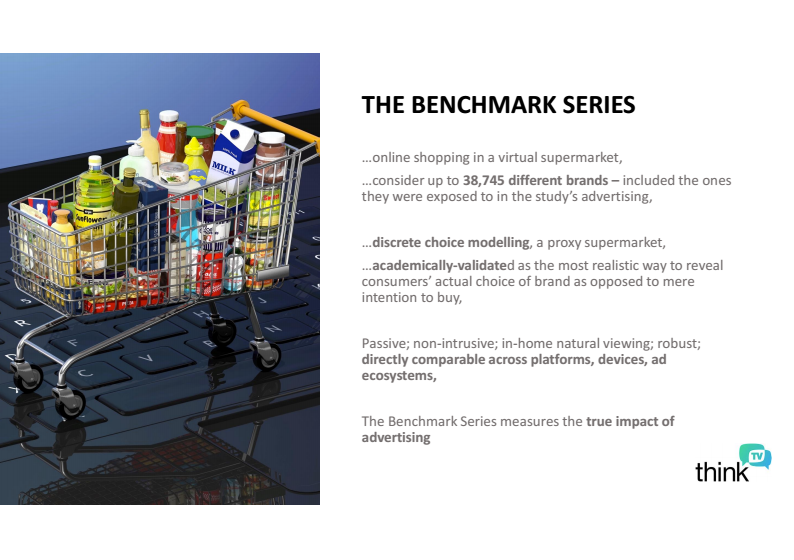
Using bespoke A.I. machine-learning technology and eye-tracking software, 2583 Australians were exposed to 18,219 advertisements under natural viewing conditions in the home. Respondents were then tasked to go shopping in an online shopping mall, where they were able to consider up to 38,745 different brands including the ones they were exposed to in the study’s advertising. Called ‘Discrete Choice Modelling’, this approach is widely used and is academically-validated as the most accurate way to reveal consumers’ actual choice of brand as opposed to mere intention to buy.

Source: ThinkTV
N.B. Professor Nelson-Field measured TV viewing on TV sets, desktops and laptops and measured Facebook and YouTube viewing on laptops and desktops. The second phase of the Benchmark Series will capture mobile viewing data for TV, YouTube and Facebook, providing further insights that are scheduled to be released in 2018. Professor Nelson-Field expects, based on previous, unreleased work she has carried out in this field, that the same patterns for attention and sales impact will hold when the mobile results are released.
Source: ThinkTV
** How is STAS measured?
STAS is the acronym for Short-Term Advertising Strength. STAS is calculated by determining the proportion of category buyers who bought a specific brand having not been exposed to that brand’s advertising, and comparing this to the proportion of category buyers who were exposed to advertising and went on to buy the brand. A STAS score of 100 indicates no advertising impact in that those who were exposed to the advertising were just as likely to purchase as those who were not. A score above 100 indicates that the advertising had an impact on sales.
About Professor Karen Nelson-Field
As head of Professor of Media Innovation at the University of Adelaide, Karen is globally recognised as an innovator in media research. Her work has been referenced by the likes of Forbes, Fox Business, Bloomberg Business and AdAge, and her book, Viral Marketing: The Science of Sharing, is a best seller in its category. Karen was awarded the NewsCorp ‘Women in Innovation’ award in 2014 & 2015 and has also received the Telstra Business Women’s Award for ‘Business Innovation’.
About ThinkTV
ThinkTV Pty Ltd is a dedicated research-driven, marketing and technology development company focused on helping the advertising and marketing community get the very best from commercial TV. From understanding how audiences engage with TV to celebrating advertising creativity, ThinkTV leads a collective effort to demonstrate how advertising in broadcast-quality content environments provides the greatest return on investment. Think TV was formed in May 2016 with founding members Nine Network, Seven Network, Network Ten and Multi Channel Network/Foxtel. Thinktv.com.au @ThinkTV